Have you ever found yourself asking yourself, “I can’t tell if these numbers mean we are better better or worse?”, or reacting in joy or dismay that this week your team is “green” or “red” without really understanding why?
Mark Graban’s new book Measures of Success: React Less, Lead Better, Improve More![]() is the guide that gives us a better understanding of how we can dampen the noise of variation, and instead focus on the insights that data can provide in our quest for improvement.
is the guide that gives us a better understanding of how we can dampen the noise of variation, and instead focus on the insights that data can provide in our quest for improvement.
Book giveaway – ended
 Mark and I teamed up to offer three lucky winners a chance to win a free copy of his book. Congratulations to readers Christoper, Sudhindra, and Amber on winning! Enjoy the book.
The giveaway may be closed, but you can still buy Measures of Success on Amazon or other booksellers.
Thoughts on Measures of Success
Throughout reading Measures of Success, I found myself nodding or chuckling in recognition of the scenarios that Mark describes about challenges or fallacies with how we use data in our organizations. I’m sure you will find yourself nodding too as you recognize your organization, self, or leadership team.
Just in the past two weeks I was in two senior leadership meetings and several issues that Mark address in Measure of Success came to mind:
- Data displayed in a grid format or in a bar chart making it difficult to see trends or know if the organization is on or off track…
- Data displayed with no context beside a target line….
- Celebration that the team was “green” this month, but last month they were “red” and the prior month they were “green”…
- Suggestion to put in a “trend line” as a countermeasure to understand the trend in performance…
At both meetings I asked deeper questions about variation and suggested that both teams read Measures of Success as a step towards understanding a better way of displaying data, such as using Statistical Process Charts (SPCs) that Mark describes in detail.
I’m hopeful that the frameworks and insights that Mark describes in Measures of Success will help both teams advance their use of data to inform progress and actions towards better.
Q & A with Mark Graban about Measures of Success
 Full transparency – Mark and I have been colleagues and friends for many years. We first met when I was the Director in the Performance Improvement Department at Lucile Packard Children’s Hospital nearly a decade ago (yikes – time flies!).
Mark was an invaluable “blogging coach” to me when I first started this blog 3.5 years ago when I moved to Japan, and since then I’ve been a guest on his podcast several times:
- Podcast #233 – Katie Anderson, A Lean Thinker Living in Japan
- Podcast #275 – Katie Anderson: Lean Reflections on Living in Japan
- Podcast #302 – Katie Anderson on Japan: Standard Work, Customers, and Healthcare
I’m happy to have the tables turned and for me to have a chance to in the interviewer’s seat!
Read on to learn what Mark had to say about data, his recommendations for leaders, and what he is thinking about now about improvement.
1. What problem were you trying to solve by writing this book? (aka – What was keeping you up at night?)
It wasn’t literally keeping me up at night. But, in my travels, I’ve seen some patterns and common practices in healthcare and the context of “Lean Daily Management” (or whatever term an organization uses). I see a gap between what is (widespread use of “bowling charts” or dashboards that consistent of tables of numbers) and what could be (the use of “process behavior charts”).
The problem with the current state is that it’s very difficult to see trends when looking at tables of numbers. It’s hard to tell if a metric is improving, getting worse or (very likely) just fluctuating around an average. Even if “red is bad, green is good” color coding is added to the tables, that leads to a lot of knee jerk reactions… being happy when the metric is green and leaping to action when the metric becomes red.
What I see keeping people up at night (maybe literally) is the time and effort that goes into explaining (or cooking up explanations for) every up and down in a metric. This is very time consuming… it’s not a good use of time to react to “noise” in a metric.
Process behavior charts give us visual statistical guidelines to filter out noise so we can respond to meaningful “signals” in our data. As I say in the subtitle of the book, when we react less and lead better, we can improve more.
2. In your experience, why is it challenging for leaders and managers to adopt the use of process behavior charts to understand the impact of normal variation on processes?
It’s really important that leaders understand “normal variation” (a.k.a. “noise” or “routine variation”) and how to distinguish that from “special cause variation” (a.k.a. “signals” or “exceptional variation”). It’s exhausting and counterproductive to react equally to every “red” data point or every below-average data point.
As I’ve often said, “You can’t blame people for what they haven’t been taught.” Many people were taught to use bowling charts or simple “run charts” (that show data over time with a target) by their consultants or Lean books.
I was fortunate to have been exposed to “statistical process control” (SPC) methods and the work of W. Edwards Deming and Donald J. Wheeler very early in my career. Toyota says that Deming is the core of their management philosophy. Toyota uses “control charts” at various levels of the organization. But, people aren’t getting exposed to this approach or it’s relegated to being part of Six Sigma (even though the methods long pre-date Six Sigma or even TQM).
I included a short section on SPC charts for metrics in the first edition of Lean Hospitals, but I rarely see them being used, unfortunately. These methods are easy to learn and make an impact when they are used. I’m hearing many stories about the impact from early readers of the book, even if they run into change management challenges related to implementing new methods. Many leaders don’t see anything wrong with their current state management approaches. So, it’s hard to get them to consider an alternative.
3. You talk about how setting targets can perhaps distract organizations from achieving improvement. What do you counsel instead of target setting?
I think target setting is a reality in modern organizations. Targets are often quite arbitrary and I’d advise against spending much time debating whether a target should be 97% or 97.5% percent. I think targets become a distraction when the binary “green is good, red is bad” view gets in the way of continuous improvement.
That said, I subscribe to the Toyota view that says we should identify gaps between our current state performance and our target (many in healthcare would call these “driver” metrics when we have gaps).
Instead of comparing single data points to the target, I recommend that people compare the average performance of their metric to the target (when a metric is fluctuating around an average). Sure, we can prioritize the largest gaps as we get started. We have to take the routine fluctuation into account when making these comparisons, though.
As we work systematically to close gaps (through A3 problem solving or other methods), hopefully we improve to the point where all of our predictable fluctuation is better than the target, as shown in the process behavior chart example shown below:
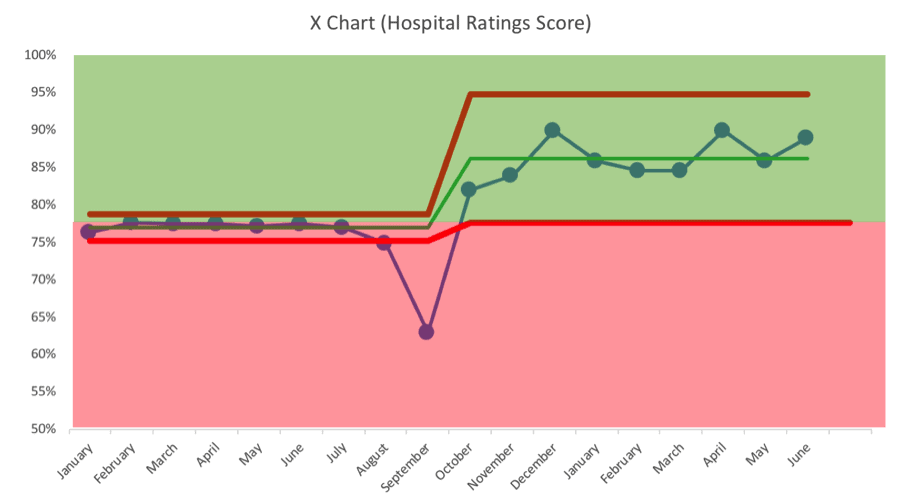
As you can see, the metric had been fluctuating around an average that was very close to the target. The consistent system was sometimes generating red results and sometimes green. After the big drop in September (a clear “signal”), improvement work boosted the average to the point where all of the fluctuation is now above the target. This organization could continue working to boost the average and/or reduce variation (which would lead to narrower limits as well).
You can learn more about the methodology through a webinar I recently did for Catalysis and that link also has information about how to calculate the “Natural Process Limits” for a metric.
4. What are some of your recommended “go-to” questions to help management teams or leaders see that the way they are currently presenting data is not providing meaningful insights, that they are being reactive to normal variation in the system, or that their trend line is not demonstrating an actual trend?
I see many (if not most) organizations reacting to every red data point (or sometimes two consecutive reds). If the metric is just fluctuating between red and green, a red data point doesn’t necessarily mean the underlying system has changed. There’s no root cause to be found for that single data point that is just noise.
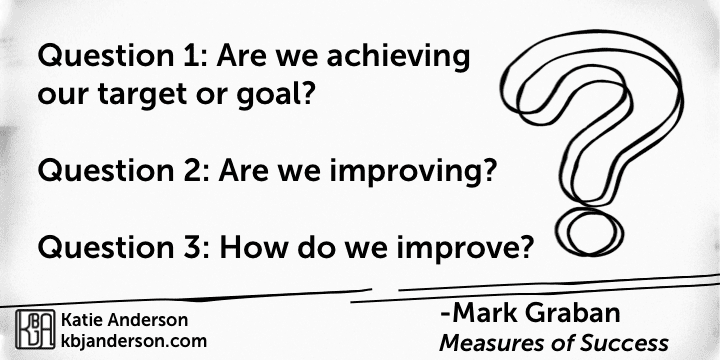
In the book, I recommend that organizations ask three questions that go beyond looking for red and green. They are:
Question 1: Are we achieving our target or goal?
- Are we doing so occasionally?
- Are we doing so consistently?
Question 2: Are we improving?
- Can we predict future performance?
Question 3: How do we improve?
- When do we react?
- When do we step back and improve the system?
- How will know if we’ve improved?
Bowling charts and run charts can’t answer all of those questions. But, process behavior charts can.
5. What is something that you learned through the research or writing of this book?
I used to teach that people should use the “Western Electric” rules for finding signals in a process behavior chart. As I revisited the book Understanding Variation and dug deeper into Don Wheeler’s other books, I realized that he was teaching that we just need three relatively simple rules to find signals in a system and a metric. This simplifies the approach without losing any validity.
Adding additional rules for finding signals increases the risk of “false positive” signals without gaining much other than complexity. So, I’ve adjusted my approach as represented in the book and the way I’ll be teaching my workshops in the future.
6. What are you pondering now about how organizations use data or pursue improvement?
I’m still really interested in the human nature (and organizational tendency) to blame individuals for systemic problems. This happens with metrics and it also happens in important situations like preventable medical error. The idea of reducing blame is something Dr. Deming emphasized, as do modern approaches including Crew Resource Management and Just Culture. I might write another book that looks at organizations that are using Deming strategies and philosophies (although they are difficult to find).
I’m also really interested in the “Motivational Interviewing” approach to counseling and the applications to organizational change management, as I introduce in Chapter 9 of Measures of Success. I’ve had a lot of good discussions with people who have read my book and were gung ho super excited to start implementing the charts. I’ve cautioned them to think about change management and not just rushing to adopt a tool. It’s helpful to ask, as John Shook would, “What problem are we trying to solve?” before introducing new solutions.
7. What is a question that you haven’t been asked about “Measures of Success” that you would like to answer? And what is your answer?
I haven’t been asked a question like, “Why isn’t this a healthcare book?” or “Why didn’t you just call this book Lean Metrics?” There are a number of reasons for doing so, but I intentionally wanted to write a book that wasn’t limited to a healthcare audience, since I’ve seen these methods be helpful in big, old manufacturing companies and small software startups.
While I think the book has pretty direct application in “Lean Daily Management” settings (as I wrote about for LEI), I’m hoping that the framing of the book draws in people who might not normally be exposed to methods like these.
I think any author wants their work to benefit as many people as possible… and I hope my book helps everyone reading this.
Thanks for asking the questions, Katie!
 Don’t forget to register for the Measures of Success Giveaway
Click here to enter the Measures of Success book giveaway.
Giveaway entries are open until Friday September 28th. Share your “lucky URL” to gain additional entries and increase your odds!
Come learn with me in Japan!
Have you always wanted to learn more deeply about the origins of Lean thinking?
Come with me to Japan on the next executive Japan Lean Study Trip that I have organized for May 12-19, 2019. Details can be found here.
Apply now to take advantage of the super early bird rate! You can read about the highlights from the Japan Lean Study Trip I led this past May to get a taste of the amazing week of learning and fun that awaits you.